“I have found that the importance of having an investment philosophy—one that is robust and that you can stick with— cannot be overstated.”
—David Booth
Global equity markets have delivered an average annual return of around 10% since 1970.1 But short-term results may vary, and in any given period stock returns can be positive, negative, or flat. When setting expectations, it’s helpful to see the range of outcomes experienced by investors historically. For example, how often have the stock market’s annual returns actually aligned with its long-term average?
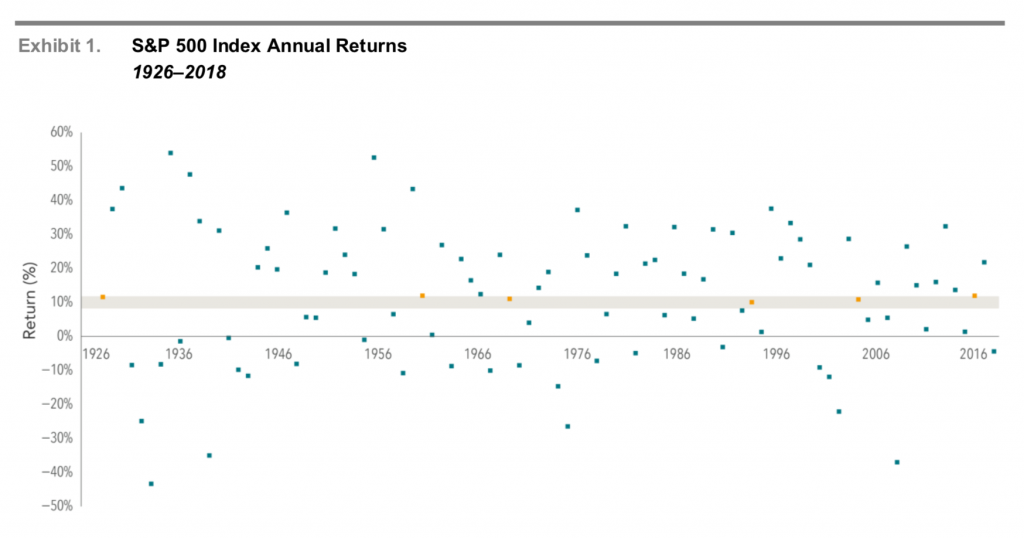
Exhibit 1 shows calendar year returns for the S&P 500 Index since 1926. Over this period, the average annual return of the S&P 500 has been 10%.2 The shaded band marks the historical average of 10%, plus or minus 2 percentage points. The S&P 500 Index had a return within this range in only six of the past 93 calendar years. In most years, the index’s return was outside of the range—often above or below by a wide margin—with no obvious pattern. For investors, the data highlight the importance of looking beyond average returns and being aware of the range of potential outcomes.
 1. As measured by the MSCI World Index (gross dividends) in US dollars from January 1970–April 2019. MSCI data © MSCI 2019, all rights reserved.
Past performance is no guarantee of future results. Performance may increase or decrease as a result of currency fluctuations. Actual returns may be lower.
1. As measured by the MSCI World Index (gross dividends) in US dollars from January 1970–April 2019. MSCI data © MSCI 2019, all rights reserved.
Past performance is no guarantee of future results. Performance may increase or decrease as a result of currency fluctuations. Actual returns may be lower.
In US dollars. S&P data © S&P Dow Jones Indices LLC, a division of S&P Global. Indices are not available for direct investment. Index returns are not representative of actual portfolios and do not reflect costs and fees associated with an actual investment.
TUNING IN TO DIFFERENT FREQUENCIES
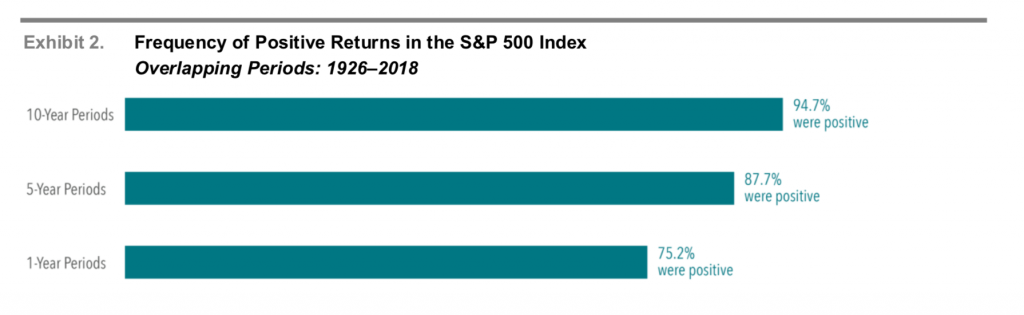
Despite the year-to-year volatility, investors can potentially increase their chances of having a positive outcome by maintaining a long-term focus. Exhibit 2 documents the historical frequency of positive returns over rolling periods of one, five, and 10 years in the US market. The data show that, while positive performance is never assured, investors’ odds improve over longer time horizons.
 2. As measured by the S&P 500 Index in US dollars. S&P data © 2019 S&P Dow Jones Indices LLC, a division of S&P Global. All rights reserved.
CONCLUSION
2. As measured by the S&P 500 Index in US dollars. S&P data © 2019 S&P Dow Jones Indices LLC, a division of S&P Global. All rights reserved.
CONCLUSION
While some investors might find it easy to stay the course in years with above average returns, periods of disappointing results may test an investor’s faith in equity markets. Being aware of the range of potential outcomes can help investors
remain disciplined, which in the long term can increase the odds of a successful investment experience. What can help investors endure the ups and downs? While there is no silver bullet, understanding how markets work and trusting market prices are good starting points. An asset allocation that aligns with personal risk tolerances and investment goals is also valuable. By thoughtfully considering these and other issues, investors may be better prepared to stay focused on their long-term goals during different market environments.
Source: Dimensional Fund Advisors Ltd. or Source: Dimensional Ireland Limited.